For World Environment Day on 5th June, we released our Sustainability Match Report. This report draws together everything we did on our momentous first ever Sustainability Match on the 3rd February vs Gulf Giants. This blog is separated into four sections. It starts with some of the highlights from the match. It then explains the (often painstaking) process of collecting data. Some comparisons with other events and teams is then provided, before finishing by explaining what comes next for Desert Vipers.
Our Sustainability Match Report highlights
The Sustainability Match had three main objectives:
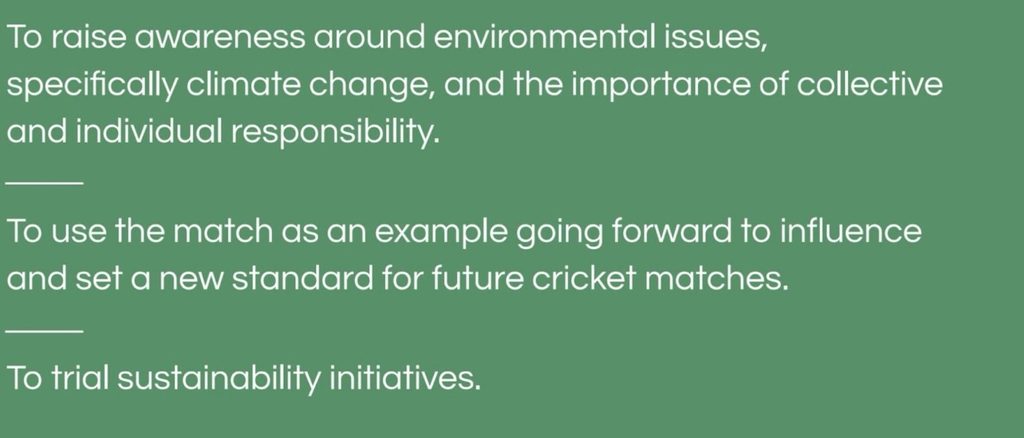
In many ways, the match was used as a celebration of the start of our sustainability journey. In quite a short space of time, we have achieved a great deal with sustainability, although there is so much more to come. This match was intended to celebrate our commitment to people and the planet, and to raise excitement around the topic of sustainability and the opportunities it can bring.
While we have already accomplished some notable achievements when it comes to sustainability, such as eradicating single-use plastic water bottles from our team environment, both sports and sustainability are about incremental gains and striving for more. For this reason, we wanted to use our Sustainability Match to trial some new initiatives, and set a new standard for future cricket matches. One of these initiatives was to place plastic recycling bins in the stadium for the first time ever. In total, we placed 20 bins in the stadium, and collected 55 kg of plastic for recycling. These plastic bottles will be turned into sports apparel, creating a circular loop. Another initiative was to place carbon footprint labels on menus in hospitality areas, which we believe might have been a first in sports?! My background from my Masters Degree was studying the carbon footprint of independent restaurants, so this was something that was close to my heart. It was fascinating to see the different carbon footprints of dishes, and, while only an approximate value, it provided some interesting discussion amongst attendees.
How we collected data
One of the outcomes of the event was that we produced a carbon footprint report specifically for the match. For this, we required a variety of different information sources.
Firstly, we wanted to understand the footprint of fan travel. For this, we created surveys where we asked fans:
- What their main transport type was to the match
- How long the journey took (people typically know how long it takes to get somewhere, rather than the distance)
- Where they came from (to correlate the time taken to the stadium with the distance)
- How many other people were in their vehicle
- What they thought could be done to make travel to matches more sustainable
The results of the survey were very interesting, as shown in the table below:
Transport Type | Journey Duration | No. of People Accounted For | % of Fans | Total No. of Fans | No. of Vehicles | Speed of Travel (km/h) | Return Distance (km) | Total Distance (km) |
Bus | 16-30 mins | 60 | 9.7% | 775 | 16 | 60 | 46 | 736 |
31-60 mins | 460 | 74.3% | 5945 | 119 | 60 | 90 | 10710 | |
60+ mins | 54 | 8.7% | 698 | 14 | 60 | 150 | 2100 | |
Total | 574 | 92.7% | 7418 | 149 | 13546 | |||
Car | 1-15 mins | 29 | 4.7% | 375 | 125 | 70 | 19 | 2375 |
16-30 mins | 8 | 1.3% | 103 | 35 | 73 | 56 | 1960 | |
31-60 mins | 0 | 0.0% | 0 | 0 | 76 | 117 | 0 | |
60+ mins | 0 | 0.0% | 0 | 0 | 80 | 187 | 0 | |
Total | 37 | 6.0% | 478 | 160 | 4335 | |||
Taxi | 1-15 mins | 2 | 0.3% | 26 | 9 | 70 | 19 | 171 |
16-30 mins | 4 | 0.6% | 52 | 18 | 73 | 56 | 1008 | |
31-60 mins | 0 | 0.0% | 0 | 0 | 76 | 117 | 0 | |
60+ mins | 0 | 0.0% | 0 | 0 | 80 | 187 | 0 | |
Total | 6 | 1.0% | 78 | 27 | 0 | |||
Metro | 1-15 mins | 4 | 0.6% | 52 | N/A | 42 | 11 | 569 |
16-30 mins | 0 | 0.0% | 0 | N/A | 42 | 32 | 0 | |
31-60 mins | 0 | 0.0% | 0 | N/A | 42 | 64 | 0 | |
60+ mins | 0 | 0.0% | 0 | N/A | 42 | 98 | 0 | |
Total | 4 | 0.6% | 52 | N/A | 569 |
The next thing we wanted to understand was our team’s impact on our footprint. For this, we calculated the emissions from the team coach, by recording the distance from the team hotel to the stadium, the fuel type, and the average fuel consumption. The other thing the team controls is our fan giveaways. We recorded the number of items given away, the average weight, the material composition, where it was produced, and what it was packaged in. These areas were under our control so we had a great deal of confidence in their measurement.
The final area which contributed to our footprint was from the stadium. There were several different elements to this, which had a varying degree of success in measurement. On the more successful side, provision of quantities of food and beverages enabled us to calculate the impact from this area. The stadium management team were also able to provide us with a rough approximation of the amount and type of waste from each match, as they gave me a tour of the waste facilities. However, we were unable to receive information in time regarding stadium electricity, air-con, gas, fertiliser, or generators. This proved quite frustrating, and shows one of the difficulties that franchises have when it comes to measuring their carbon footprint. Since franchise clubs do not own their own venue, implementing sustainability initiatives and collecting information for sustainability assessments can be extremely difficult. Mutual cooperation is needed, and we are going to try everything we can to help bring the stadium with us on our journey, and be as supportive as possible.
How we compare to other teams
Our estimated carbon footprint for the match was 23.1 tonnes of carbon dioxide equivalent (tCO2e). If every match in the ILT20 had this footprint, the tournament would have a footprint of 785 tCO2e! For Desert Vipers’ five home matches, we would have a footprint of 116 tCO2e. However, we know that our measured footprint in Season 1, including flights (which made up 70% of our footprint), was 573 tCO2. Therefore, if each of the other five teams had a similar footprint, the total tournament footprint would be 3,437 tCO2e from the teams, plus the footprint from the League management. This is a much higher number than the aforementioned 785 tCO2e, underscoring the importance of measuring not just the matches themselves, but also the activity in the build up and aftermath of the tournament, particularly flights. While it might not make sense to attribute the emissions from the teams’ flights from tournament to tournament or team hotels to an individual match, we must not ignore this source of emissions, as its inclusion (or lack of) can greatly skew the overall footprint value.
Our footprint of 23.1 tCO2e is actually very low compared to other cricket matches! For example, Edgbaston’s GoGreen game had a footprint of 327.8 tCO2e. 270 tCO2e of this figure was from fan travel, whereas our fan travel footprint was just 2.1 tCO2e. The key difference between these figures is that 93% of our fans came on buses (which were usually 50-seaters, so had a low footprint per passenger) for our match, whereas Edgbaston’s information says that they only had 6% of fans coming by bus. In football, a match in 2021 for Tottenham vs Chelsea Men, in the Premier League, was calculated as having a footprint of 862 tCO2e. Again, the majority (93%) of emissions came from fan travel. It’s clear though that reporting on the footprint of individual matches is still in its infancy, and the work that we are doing to be transparent and informative around this is helping to move the conversation forward.
What next?
Preparations for Season 3 are in full swing, with plans for Season 3’s Sustainability Match already underway. We hope to expand our successful trials from Season 2 to every game in Season 3 (we have already asked the League to put plastic recycling in all venues at all matches next year). We’re on the lookout for new initiatives to trial next season, so if you have a suggestion, please email us at sustainability@thedesertvipers.com. We hope to see you at our Sustainability Match in Season 3!
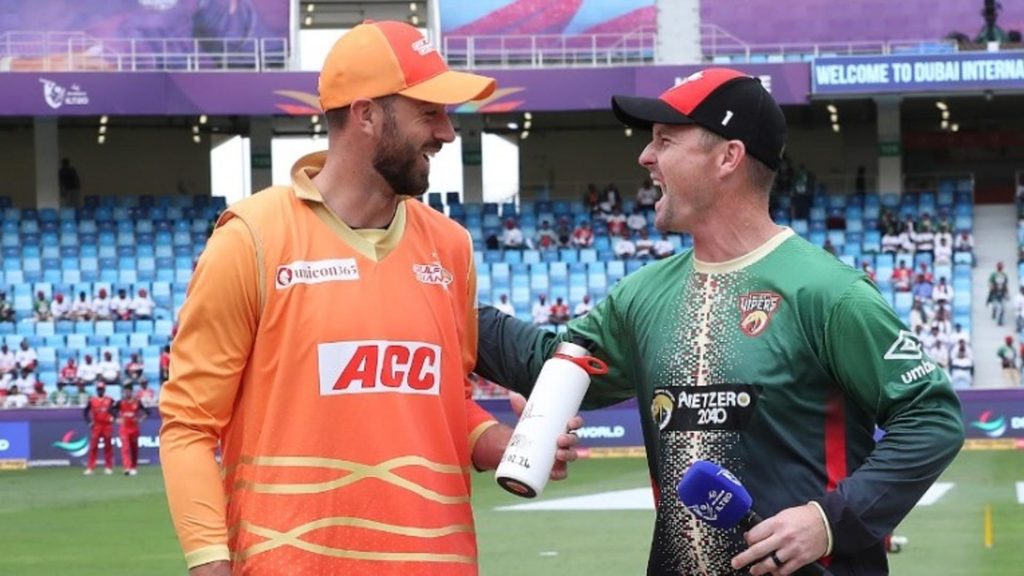
Sustainability Spotlight – Bluewater
This week’s Sustainability Spotlight focusses on Bluewater, our Official Hydration Partner. Bluewater are a world-leading purified water and beverage industry innovator, who are providing solutions to address the widespread issues across the nexus of water and plastic pollution. In Season 2, they provided state-of-the-art water filtration units to Desert Vipers, and thermally-insulated water bottles for all players and staff, to help us in achieving our goal of eradicating single-use plastic water bottles from our team environment. They were a key feature of our Sustainability Match, as our captain, Colin Munro, handed over a ceremonial Bluewater bottle to the captain of the Gulf Giants, to signify our commitment to bringing people along with us on our sustainability journey. We hope to see many more Bluewater units next to the dugout of cricket pitches in the future, and hope it soon becomes the norm, rather than the exception.